
How PSA Software Can Supercharge Forecasting Your Services Business
Unlike any other industry, professional services organizations experienced growing pains during the 2020 black swan year, calling attention to a critical question valuable to any business leader.
How quickly and effectively can you shift your business efforts when your market takes a turn?
No one could have predicted the mass transition from on-prem work to remote work seemingly overnight, and many businesses have been left with a tremendous opportunity of refocusing resources and services on the fly.
The key to supercharged forecasting is proactive positioning
Historical analytics is valuable to gauge trends and seasonality, but should your backlog and pipeline undergo sudden change disrupting the predictable nature of your revenue streams, being “proactive” may take on a new meaning.
Here are a few questions to ask yourself to evaluate readiness for the unexpected:
- How diversified are our revenue streams?
- How flexible are our resource allocations?
- Am I capturing enough data to drive our KPI decisions?
- Do I have comparative analysis tools such as baseline, optimistic/pessimistic scenario, or multi-budget reporting?
Let’s take a more in-depth look at these questions and how you can leverage forecasting to be fluid and flexible if your business is thrust into change.
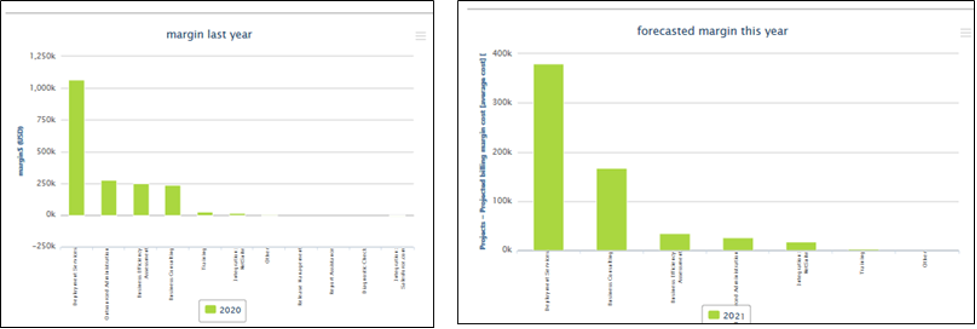
How diversified are our revenue streams?
Some organizations treat their revenue streams and lines of business the way investors treat their portfolios. Some mitigate the volatility of higher-margin revenue services by including steadier, non-volatile services, while others may remain flexible in pivoting existing service models to meet new demands.
In the services world, diversification may not mean that you explicitly should offer equal parts Fixed Fee and Time and Material services, but that your resources can be viewed as the “revenue streams” for which you should be ready to pivot when the occasion calls. For example, if a primary revenue driver is certain SaaS product sales, but an unseen turn in the market shifts your engagements toward Ad Hoc Maintenance, effectively moving resources can significantly impact your bottom line.
This is where forecasting comes in. Forecasting margin by projecting current trends can give immediate insight into how you should allocate resources to minimize the cost of services rendered and provide a spotlight for your sales team to focus on stable revenue leads.
Whether or not your service offerings aren’t as diversified as your resource pool, you should have a tight grasp of your resource allocations to maximize productivity and proactivity.
How flexible are our resource allocations?
Shifting and motivating resources to align with new business initiatives can be painful from a change management perspective. This can be overlooked as an option entirely if this is unrealistic administratively.
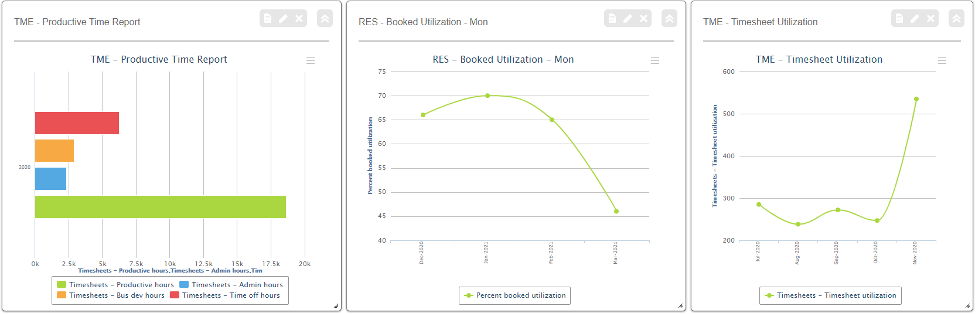
Adding or expanding resource productivity metrics can add long term value to your business as well as your resources’ skillsets.
Some organizations focus solely on their resources’ billable efforts, while others have a blended utilization measurement to track efficiency. This may be as simple as adding a measurable numerator/denominator to resource tasking or developing internal projects to create new or enhance existing products and service offerings.
The key to flexible allocations is fast information on forecasting shifting resource demands. If you already know the trends in certain project types, task productivity, or resource margin, you will need a clear picture of where resources are allocated and where you need to make changes.
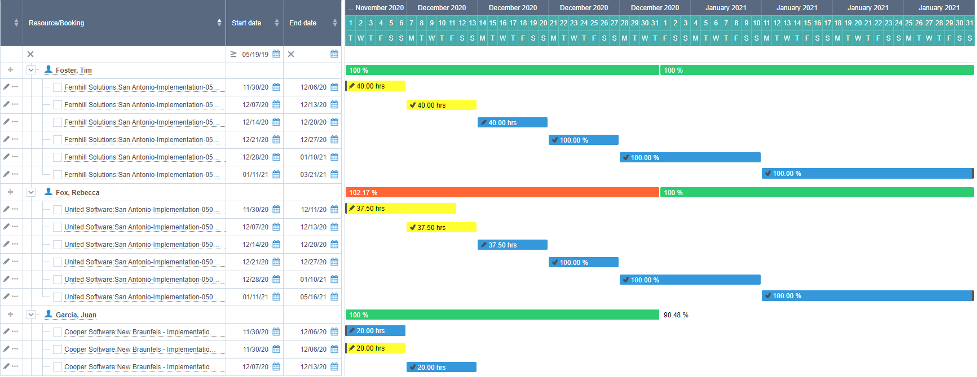
Having a dynamic real-time (or near real-time) view of allocated resources will allow your resource management to be more proactive when forecasts illuminate a need down the road.
Am I capturing enough data to drive our KPI decisions?
In addition to the idea of productivity and effective resource allocations, capturing the right information is important to supplement changes or highlights to KPI decisions. From a change management perspective, it is more difficult to achieve high user adoption for productivity measurements if there is no data to support the change. Engage with department leaders to gain insight on groupthink opportunities, and take action on inculcating change toward your KPIs.
In the productivity example, it may be useful to have metrics front-and-center daily or weekly to create personal awareness of “added value.”
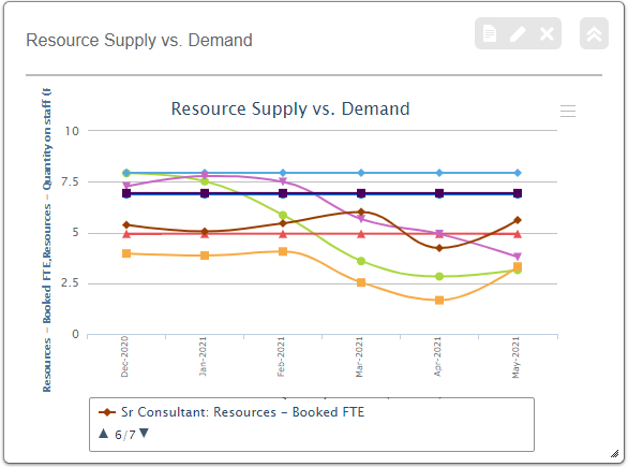
Dashboards, reports, and other business intelligence options can also be useful for identifying high-level opportunities. For example, identifying Supply and Demand for certain resource roles can help determine if an immediate top-level change should be considered or if more research should be applied to an area in need.
Do I have meaningful comparative analysis tools?
Black swan events can help open a blind-eye to “what-if” scenarios. The “Black Swan Year” 2020 has crystalized the need to be prepared for those scenarios. Forecasting tends to come in optimistic stakeholder-biased colors. While this is useful for inspiring and achieving loftier goals, preparedness means a more multi-faceted analysis than “reach-higher” goals.
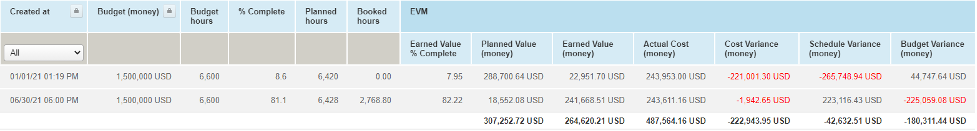
Baselines are a valuable tool for comparative analysis of how an engagement is progressing. Create a baseline and treat them as regular checkpoints, such as once every month or quarter, to track variances in budgets and profitability.
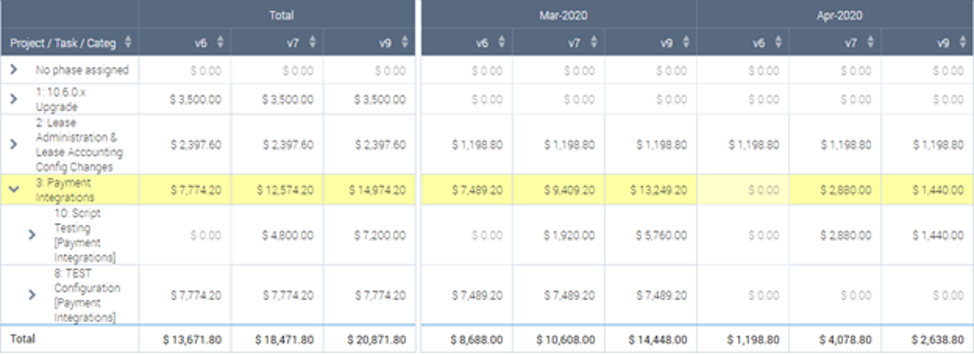
Another useful comparative measurement is to use Budget Version comparison. This method allows you to create multiple versions of budgets to account for different scenarios such as prospective change orders, optimistic or pessimistic contingencies, or budget striations. This type of analysis can help outline different “futures” in which you can forecast results and tactically see where you need to focus efforts.
Key Takeaway
Proactive measures aren’t always making changes with 20/20 foresight. When unforeseen macro-level changes affect your organization, leveraging forecasting tools and malleable resourcing can place your organization in a position of swimming with the current rather than against it. Analyze your revenue-drivers, understand your resource effectiveness, and model/track your forecasts’ various scenarios.