Creating Project Specific Reports in OpenAir
OpenAir has the ability to filter and aggregate values for reports in project-specific contexts without the need to set a filter in the report directly. Because the reporting Project filter does not allow for meta-data filtering (e.g., “My Owned Projects”), to create project-specific reports, you would need to have one report for each project.
The “Make this report available in project-specific situations” option in report settings allows you to add the report either as a dashboard chart, or quick access report in the project’s report tile. When being accessed from the project’s dashboard, OpenAir will automatically filter the report results to the project from which the user is accessing.
To mark a report project-specific, navigate to the Settings pane on the left-hand side of the report and check the “Make this report available in project-specific situations” box:

Key traits of a functional project-specific report
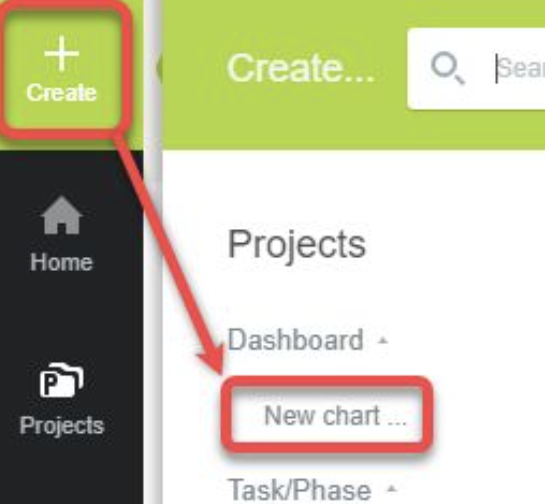
When creating a project-specific report, it is important to remember that to use it for a chart, you must have a reasonable metric measurable over a period of time. For example, you may wish to capture a single department’s trend month-by-month, or a several department’s values for a single month. To add a chart to a Project dashboard, within the Project, click “Create (+) : New dashboard” and choose the report you wish to add:


Example chart:

When you access the report from the Project dashboard “Report” tile, it will automatically filter the results to the Project from which you are accessing:

